What IS DisProportionality IN special Education?

Quite simply, disproportionality refers to a condition in which there are more (or fewer) children from a particular group identified as having a particular disability, or placed in a specific disability category, than that group's representation in the general population would lead us to expect. For example, when considering their total numbers in regional or national population counts, African American, Latino and Native American students are far more likely to be classified as having an intellectual disability, emotional or behavioral disorder than their white counterparts.
How can we assess the problem
In the wake of No Child Left Behind (NCLB), districts are collecting mountains of data on the ethnic and demographic breakdown of students served by special education. This enables educators to look past aggregate tallies of over-representation and focus on referral pattern problems endemic to specific localities. We have known for some time that there are higher percentages of minority students with low socio-economic status (SES) in large, urban school programs. Research also supports that the disproportion of minority students in special education is directly proportional to the size of the education program.
Examination of our own state’s statistical data can shed light on our own unique system biases. Weighted risk ratios are a measure of the risk that a student from a particular ethnic or racial group will be served in a specific disability category compared to the risk of all other students served in that category. Bycross referencing EBD weighted risk ratios in the OSPI 2013 Performance Data Profiles with the individual demographic breakdowns provided by OSPI in the Washington State Report Card (2013), we can identify district trends.
Examination of our own state’s statistical data can shed light on our own unique system biases. Weighted risk ratios are a measure of the risk that a student from a particular ethnic or racial group will be served in a specific disability category compared to the risk of all other students served in that category. Bycross referencing EBD weighted risk ratios in the OSPI 2013 Performance Data Profiles with the individual demographic breakdowns provided by OSPI in the Washington State Report Card (2013), we can identify district trends.
|
For example, in the Northshore School District, Black students are 1.7% of the population and they have a weighted risk ratio 1.3 in the EBD category.... |

|
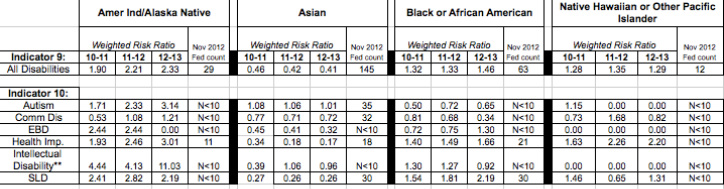
...and they have a weighted risk ratio 1.3 in the EBD category (2012-13).

By contrast, Black students are 18% of the student population in the Seattle School District...

...and they have a weighted risk ratio of 2.51 in the EBD category.

The story is appears worse for Native Americans who make up 1.5% of the student population in the Tacoma School District in 2012...

...with a weighted risk ratio of 10.98 for EBD classification.
This is just an example of the kind of insight that examination of one particular disability category can yield. Of course, disproportionality also occurs with regard to placement in gifted and talented programs, placement in more or less restrictive special education settings and the occurrence and severity of disciplinary actions (Skiba, et al., 2006). Just recognizing that dispropoportionality is a factor for a given group or groups is a critical first step. However, it sheds little light on the actual issues which contribute to disproportionality .
factors contributing to over-representation of minority groups
Below is a short YouTube clip that explores some of the issues in racial inequality in Special Education. It gives a broader picture of how these disparities in the diagnosis affect students who are English Language Learners.
Issues effecting the diagnosis of special EDUCTION

Issues that contribute to disproportional diagnosis of students of color and longterm placements in restrictive learning environments include:
- Objective assessments and cultural bias in diagnosis of non biological or physical disabilities (Harry & Klinger, 2006)
- Students of color are more likely to be referred into special education by their teachers, whilst White students are referred by parents (Skiba, 2001)
- Parents from CDL and lower SES may not be aware of their rights in the special education process from testing, IEP goals, to services offered to their child
- Cultural perceptions of behavior are different which influences the rate white teachers refer CLD children
- Historical racial stereotypes including the perception that Black people are more likely to be 'mentally retarded'.
- During the US Commission on Civil Rights briefing in 2007, Dr Reschly expressed that although 2% of Black children in special education were classified with mental disabilities, there are many educators and policy makers that confuse risk statistics with composition statistics (ethnic composition withing classification)

How do cultural differences in verbal and Non-verbal communication affect referrals ?
|
|
Dr. Jackie Jordan Irvin discusses the some of the cultural implications and the importance of identifying students on an individual basis. She also shares the importance of having an understanding and knowledge about how a student's culture influences the verbal and non verbal behaviors.
|
